Design & visuals
A multi-panel journal figure from a sketch
- Time
- 9 min + 3 min
- What was said
- 2 sentences
- Delivered
- Figure in 3 formats + script
The finished work
How it got made
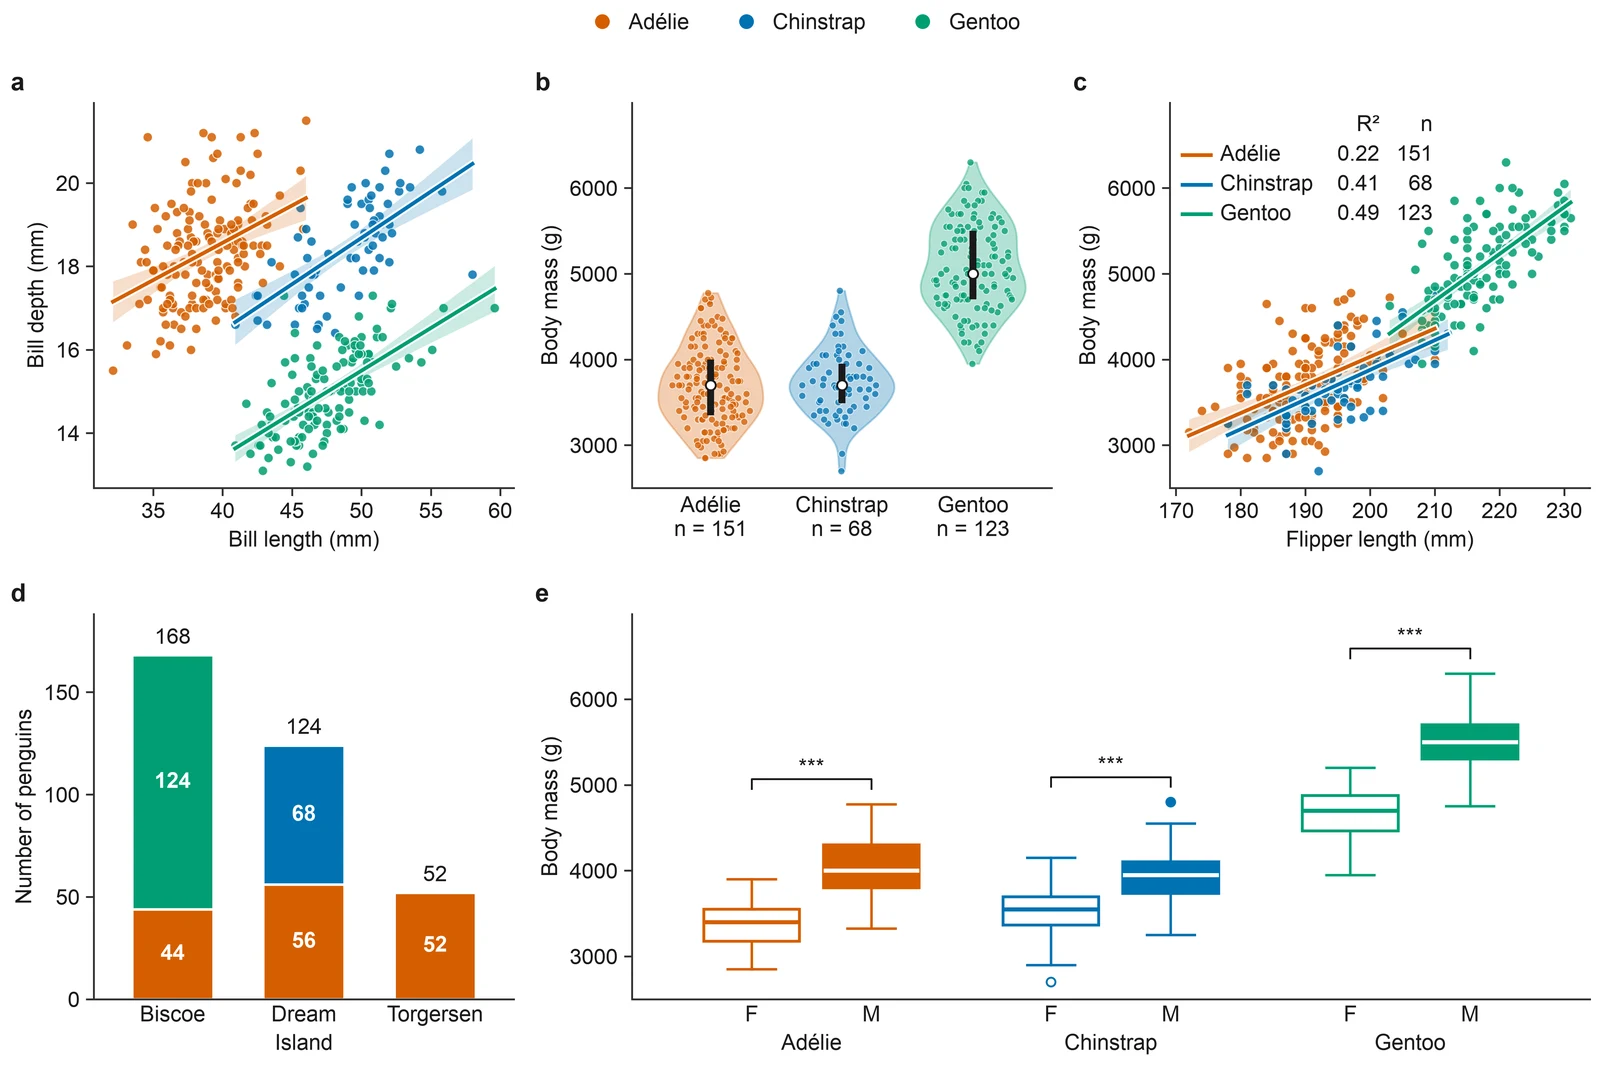
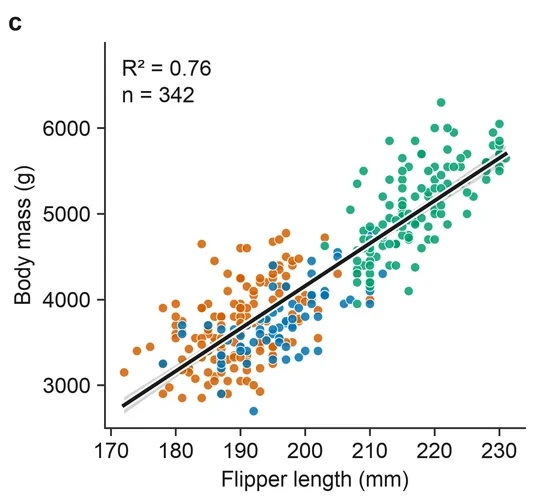
penguins.csv in the workspace is public measurement data on three penguin species from the Palmer Archipelago in Antarctica. I'm submitting to a journal; draw me a multi-panel main figure (Figure 1). Here's the sketch: three panels on top — a, bill length against bill depth as a scatter, coloured by species, with a regression line for each species; b, the distribution of body mass for the three species (violin plots with the raw points on top); c, flipper length against body mass as a scatter with a regression line, R² marked; two panels below — d, the number of each species on the three islands (stacked bars); e, body mass of females and males within each species (box plots, significance marked). Two-column width, 180 mm, no font smaller than 7 pt, a colour-blind-friendly palette, bold lowercase letters in each panel's top-left corner. Deliver SVG, PDF and a 600 dpi PNG, plus a plotting script that redraws the figure in one go; put how missing values were handled and which tests were used in a short legend.
Put the data in the workspace and send that one sentence
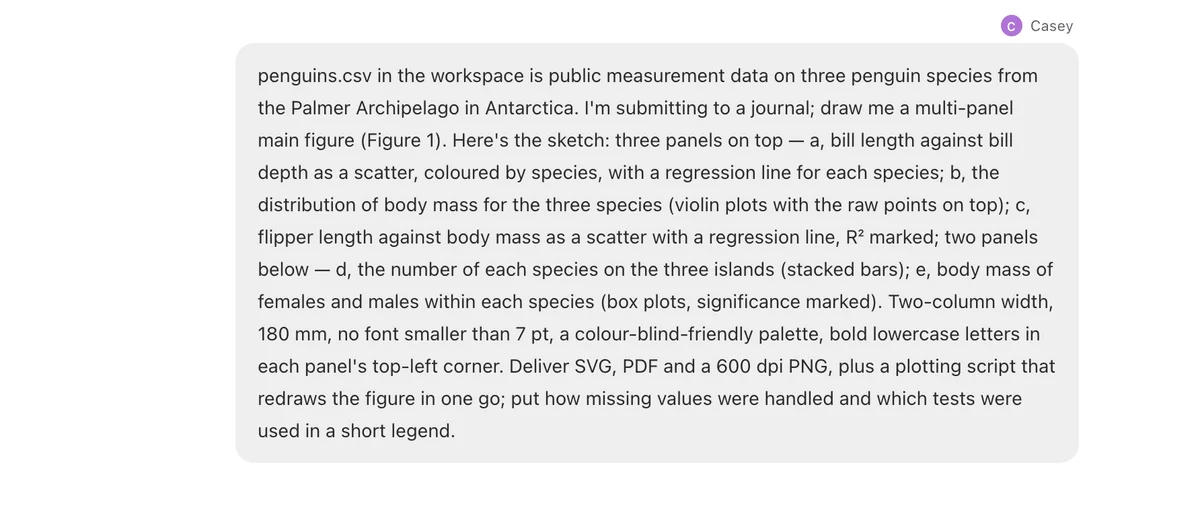
9 min later: the figure, script, legend and stats table
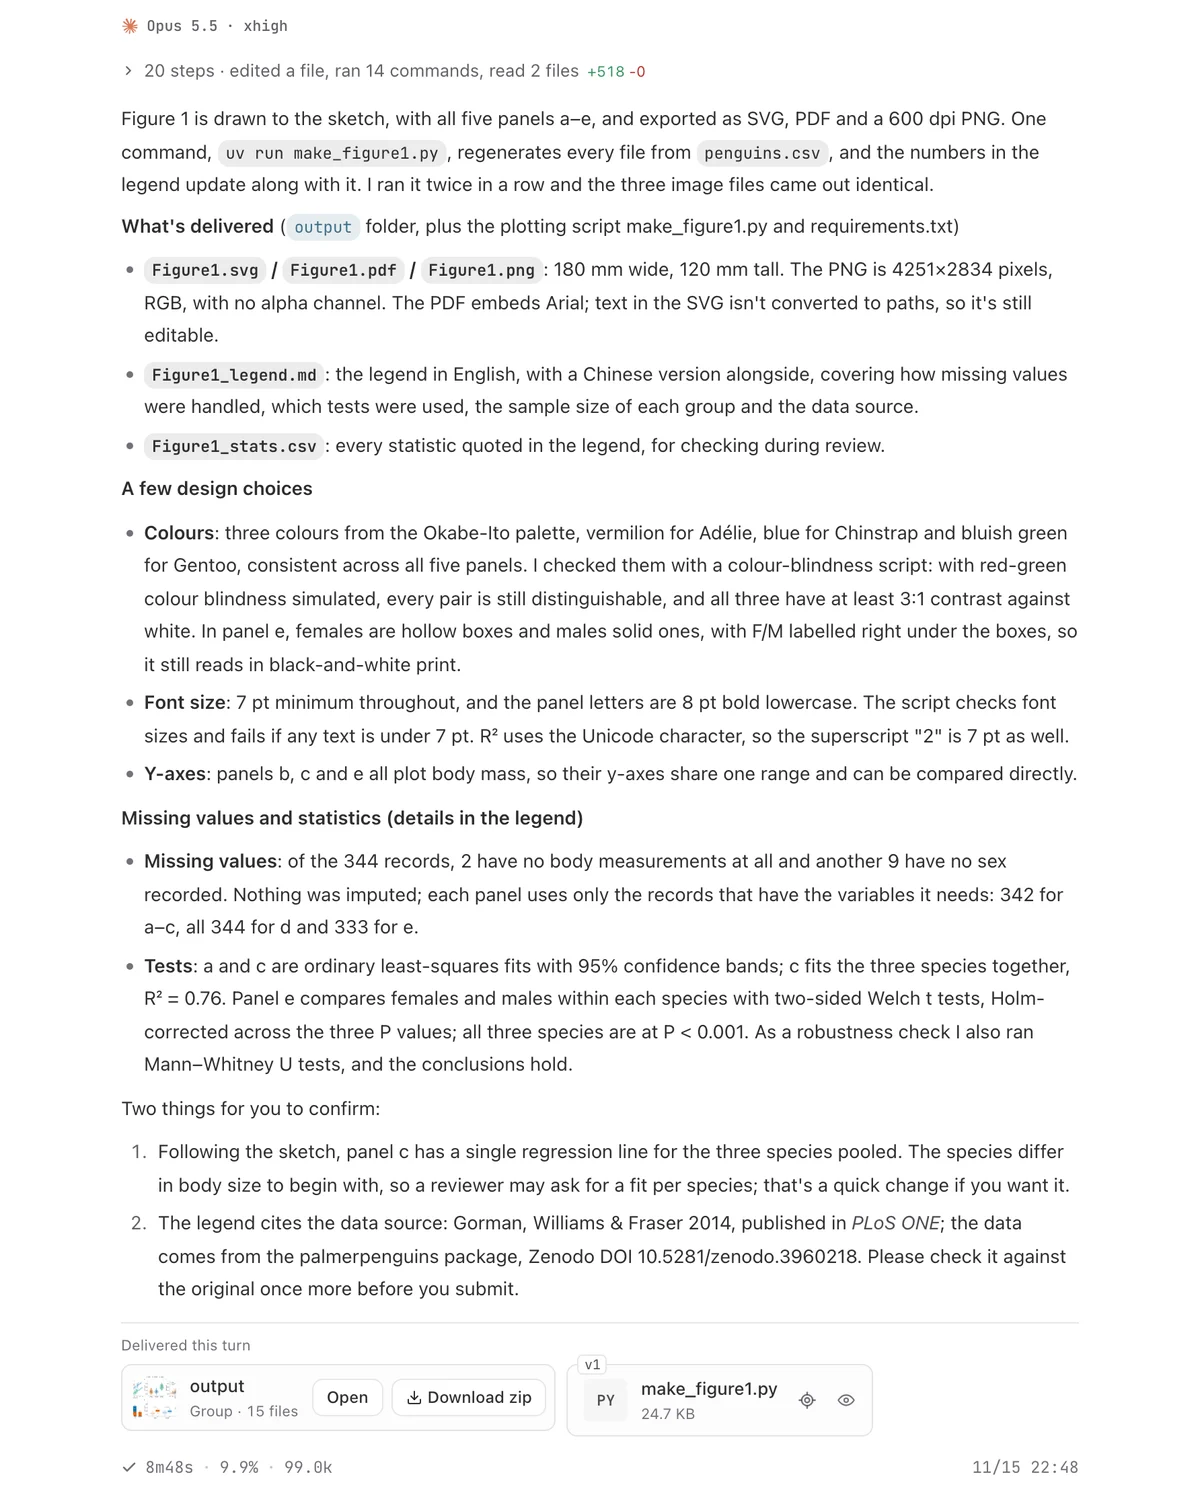
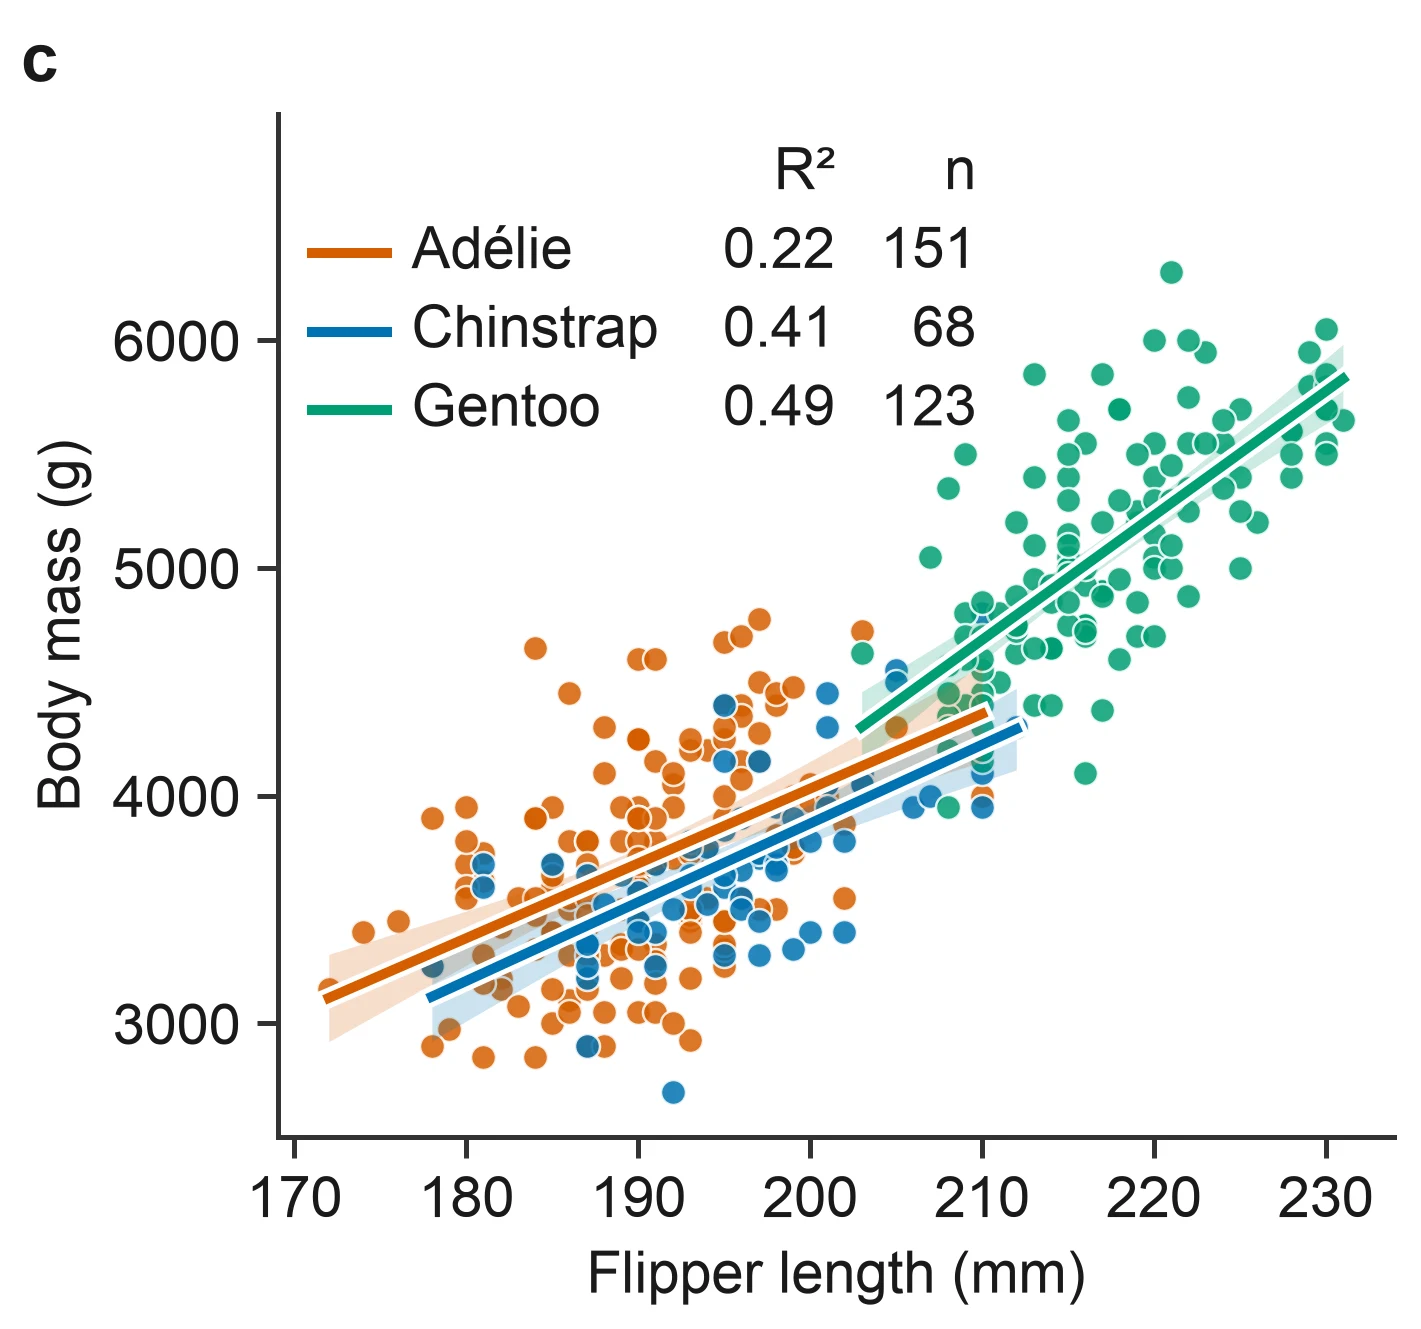
The supervisor's note: fit a line per species in panel c
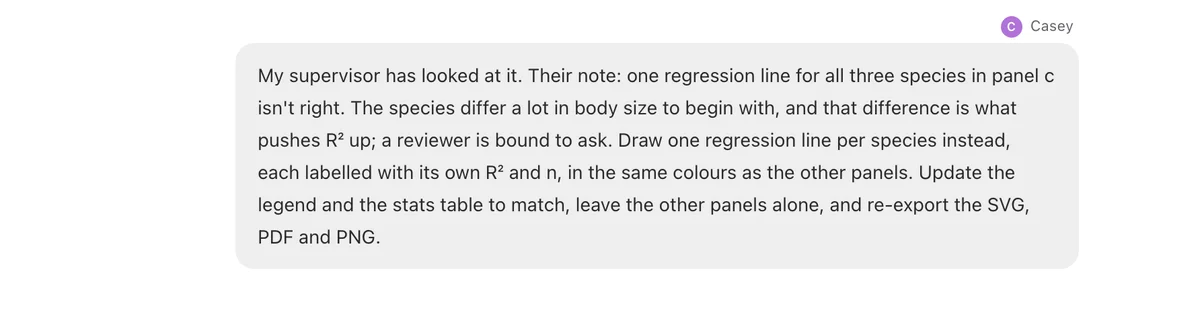
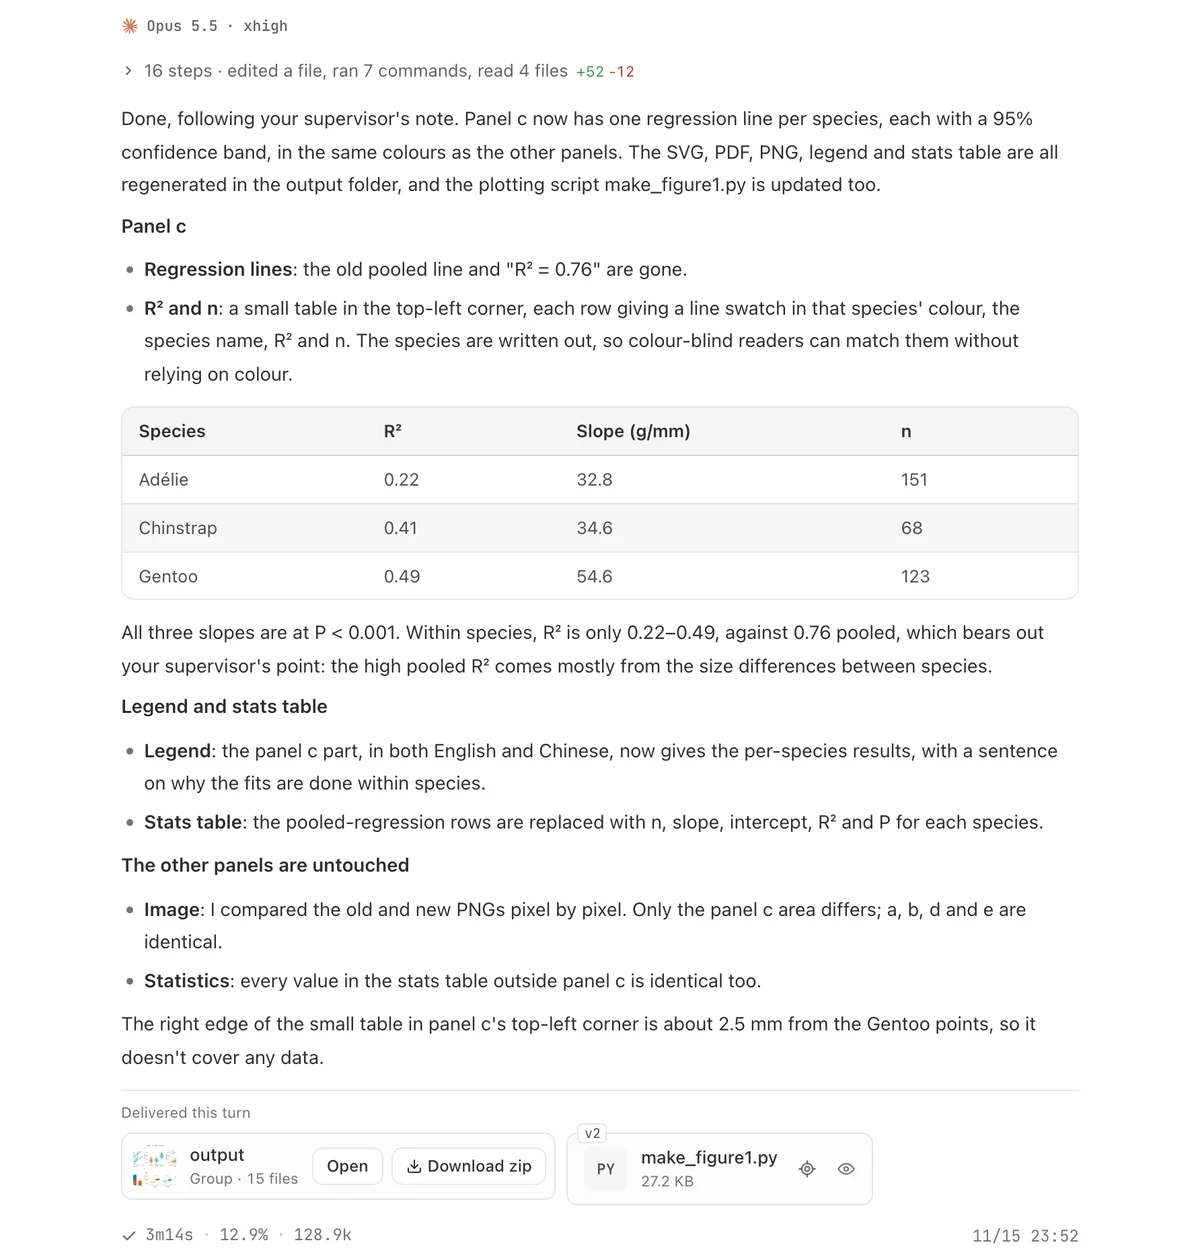
3 min later: redone, and only panel c changed